

Gore Street FY25/26 slides: NAV falls 27% on weak revenue outlook
U.S. futures hold on to gains after data shows producer prices cooled in June Introduction & Market Context Gore Street Energy Storage Fund plc (LSE:GSF) presented its annual results for the financial year ended March 31, 2026, on July 15, 2026, revealing a substantial decline in net asset value driven by weaker market conditions across its battery energy storage portfolio. The company’s NAV per share fell 27.2% to 74.9 pence from 102.8 pence in the prior year, primarily due to downward revisions in third-party revenue forecasts and operational underperformance. The presentation outlined a comprehensive strategic response including enhanced shareholder distributions, selective asset disposals, and capital recycling initiatives designed to stabilize returns and position the fund for long-term growth.
The fund operates 28 battery storage assets across five markets with total capacity of 1.16 GW. Following the results, shares traded at $45.822, down 7.05% from the previous close of $49.30, trading near the lower end of the 52-week range of $43.20 to $64.50. Financial Performance Highlights
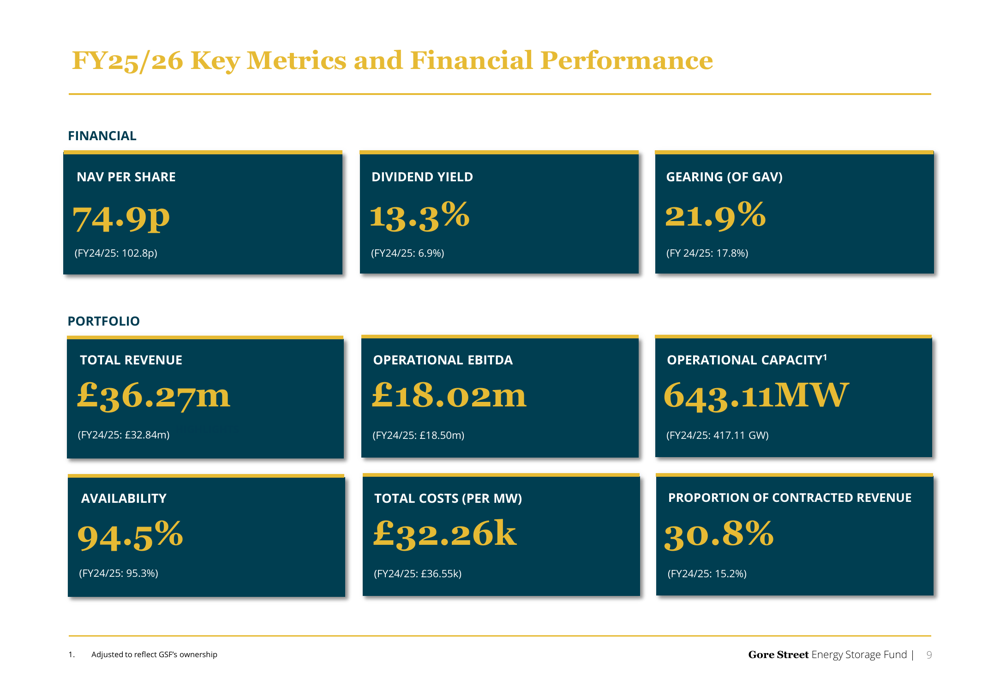
The following chart illustrates the fund’s key financial and portfolio metrics for the fiscal year. Despite the significant NAV decline, Gore Street reported total revenue of £36.27 million, up from £32.84 million in the prior year, reflecting the addition of new operational capacity. However, operational EBITDA decreased slightly to £18.02 million from £18.50 million, and adjusted fund earnings after debt service fell sharply to £5.96 million from £9.82 million.
The company’s operational capacity expanded substantially to 643.11 MW from 417.11 MW, while maintaining strong availability at 94.5%. The proportion of contracted revenue increased to 30.8% from 15.2%, providing greater income stability. Total costs per megawatt declined to £32.26k from £36.55k, demonstrating improved operational efficiency.
Gearing increased to 21.9% of gross asset value from 17.8%, though the company maintained a conservative financial position with £51.6 million in group cash and £37.8 million in undrawn debt capacity. Detailed Analysis of NAV Decline The presentation provided a comprehensive breakdown of the factors driving the 27.9 pence decline in NAV per share, as shown in the following waterfall chart.
Revenue curve revisions represented the largest single impact at -19.0 pence, or -£95.8 million, reflecting weaker market conditions and downward adjustments to third-party forecasts. The company explained that it uses mid-case blended averages from multiple independent curve providers, with additional conservative adjustments directed by the Audit Committee for near-term projections. The following charts illustrate the magnitude of revenue curve revisions in the fund’s two largest markets.
In Great Britain, revenue forecasts were revised downward across the entire projection period, with peak annual revenues declining from approximately 90,000 GBP/MW to under 80,000 GBP/MW. The United States saw even more substantial revisions, with near-term forecasts cut from around 220,000 GBP/MW to approximately 100,000 GBP/MW. Actual revenue performance also fell short of forecasts by 6.1 pence, while operating expenditure assumptions increased by 5.6 pence to reflect forecast project oversight costs and a broader buyer universe for assets.
Fund-level expenses reduced NAV by 2.3 pence, and dividend distributions accounted for 4.2 pence. These negative impacts were partially offset by DCF rollover effects of +9.3 pence and inflation assumption changes of +1.1 pence. The company’s valuation methodology employs discounted cash flow analysis across the portfolio, with key inputs sourced from multiple independent specialist providers and assessed by the Audit Committee.
Valuation experts BDO oversee the process, while EY reviews all material inputs and audits the financial statements. Portfolio Diversification and Market Performance Gore Street’s portfolio spans 28 assets across five geographic markets, providing diversification benefits as shown in the following breakdown. The portfolio’s geographic distribution by energy capacity shows California representing 44% of total MWh, followed by Great Britain at 32%, Texas at 15%, Island of Ireland at 6%, and Germany at 3%.
The portfolio is diversified across multiple system integrators, with Nidec and LSES each representing approximately 29% of total MW capacity. Asset age profile shows the portfolio is relatively young, with 76% of capacity less than three years old. Revenue composition indicates 69% merchant exposure, with 20% contracted in the United States and 11% contracted in non-US markets.
Market conditions weakened across all geographies during the fiscal year, as illustrated in the following regional analysis. Great Britain experienced strong performance in the first half but weakened in the second half due to a milder winter. Approximately 2 GW of new BESS capacity was installed during the year, contributing to market oversupply.
The portfolio weighted average revenue was £5.6 per MW/hr. California saw merchant revenues decline 41%, though income remained largely supported by Resource Adequacy contracts. The market added 5 GW of new BESS capacity while installed solar and wind capacity increased by 4 GW.
Average daily real-time energy spreads declined 22%, resulting in portfolio revenues of £8.1 per MW/hr. Texas experienced the most challenging conditions, with portfolio revenues of just £2.5 per MW/hr. The revenue stack shifted substantially away from ancillary services toward wholesale trading, with total ancillary service revenue share falling 24 percentage points year-over-year.
Island of Ireland remained the strongest performer at £14.9 per MW/hr, benefiting from high-SNSP intervals that rose 56% year-over-year. Germany delivered £14.6 per MW/hr, with automatic Frequency Restoration Reserve contributing 61% of revenue, up from 47% in the prior year. Operational Excellence and Cost Management Despite challenging market conditions, Gore Street demonstrated operational resilience through its proprietary optimization platform and cost management initiatives.
The company’s in-house GSET optimizer, which oversees approximately 38% of the operational portfolio, continued to outperform sector benchmarks in both Great Britain and Texas. In Great Britain, GSET generated aggregated alpha of £520,000 above the Modo benchmark, achieving £6.01 per MW/hr compared to the benchmark of £5.62 per MW/hr, representing 9% outperformance. In Texas, where the portfolio was onboarded between August and September 2025, GSET delivered 14% outperformance with £2.80 per MW/hr versus the £2.47 benchmark, generating £50,900 in additional value.
The asset management team’s data-driven approach protected value through automated analytics, reduced operational risk, and proactive management, maintaining 94.5% availability across the portfolio. These efforts contributed to insurance premium reductions of approximately £700 per MW from the May 2026 renewal period. Total management and operational costs declined substantially.
Investment manager fees fell £815,000 through removal of exit and performance fees and a shift to 50/50 NAV/market cap fee basis. Commercial management fees decreased £396,000 through exit fee removal and service fee reductions. The proprietary asset management data platform reduced costs by approximately £300,000 annually.
ESG Performance and Sustainability Impact The operational portfolio delivered meaningful environmental benefits during the fiscal year, as highlighted in the following metrics. The portfolio avoided 15,142 tonnes of CO2 equivalent emissions, representing a 26.5% increase versus the prior year and equivalent to removing approximately 3,300 passenger vehicles from roads for one year.
Renewable electricity stored totaled 56,975 MWh, up 45.0% year-over-year and sufficient to power approximately 23,000 UK households annually. The company plans to publish its fifth annual ESG & Sustainability Report in autumn 2026 with additional performance details. Strategic Response and Capital Allocation Management outlined a comprehensive strategic framework announced in March 2026 designed to recycle capital from mature assets into higher-return opportunities while capturing value from existing and augmented assets.
The strategy encompasses four core components: enhanced distributions, selective disposals, capital recycling through development and augmentation, and strengthened stakeholder alignment. The approach aims to convert operational income and disposal proceeds into a capital pool for reinvestment in opportunities targeting approximately 15% IRR. The company established a new distribution policy targeting 7 pence per share annually, delivered as regular quarterly payments of 1.75 pence.
For FY25/26, total distributions declared were 4.19 pence per share, with the Q4 dividend of 1.75 pence declared on July 15, 2026, for payment around September 1. Fee reductions totaling £1.2 million versus the prior year strengthened stakeholder alignment, comprising £815,000 from investment management agreement changes and £396,000 from commercial management agreement revisions. Post-period initiatives include bringing asset management in-house across Great Britain and Ireland and deploying a technology-led management platform across the portfolio.
Progress on the disposal and capital recycling strategy is advancing, as shown in the following breakdown. The company has 417 MW currently in sales processes, including advanced negotiations with multiple offers for the 22 MW Cremzow asset in Germany. Sales processes were initiated for Middleton (200 MW in Great Britain), Kilmannock (120 MW in Republic of Ireland), and Mucklagh (75 MW in Republic of Ireland).
Against the disposal KPI of £25 million for FY26/27, the company has £25 million in progress. On capital recycling, augmentation projects at Stony (79.9 MW/MWh) and Ferrymuir (49.9 MW/MWh) are underway, targeting an additional 130 MWh by December 2026. The company has already completed 129.80 MWh against the FY26/27 KPI of 100 MWh.
Valuation Sensitivities and Scenarios The presentation included comprehensive sensitivity analysis illustrating how changes in key assumptions would impact portfolio valuation. A 1% change in inflation assumptions would move NAV by -11.5 to +12.9 pence per share, while a 1% change in discount rates would impact NAV by -11.0 to +12.9 pence. Currency movements of 3% would affect NAV by -1.5 to +1.6 pence, and EPC cost changes of 10% would impact NAV by -2.0 to +2.0 pence.
Scenario analysis shows that non-operational assets progressing to their commercial operation dates represents £69.2 million of potential upside. High and low revenue cases demonstrate -33.1 pence downside and +20.5 pence upside respectively. Applying operational discount rates to construction assets would add 13.7 pence to NAV.
Balance Sheet and Financial Position The company maintained a conservative financial structure despite increased gearing, as detailed in the consolidated balance sheet. Total net asset value stood at £378.32 million, with investments at fair value of £373.09 million representing the core portfolio.
Current assets included £6.23 million in cash and cash equivalents and £0.35 million in receivables. Current liabilities of £1.35 million were modest relative to the asset base. Aggregate group debt of £105.82 million represented 21.9% gearing against gross asset value of £484.13 million.
The company retained £51.6 million in group cash and £37.8 million in undrawn debt capacity, providing substantial financial flexibility. The revenue to adjusted fund earnings bridge shows how higher operating and debt costs reduced profitability despite revenue growth. From total revenue of £36.27 million, revenue-related costs including RTM fees and energy costs consumed £3.48 million.
Other operating costs totaled £10.83 million, while administration costs were £2.79 million and rent £1.16 million. Liquidated damages added £2.69 million. HoldCo operating expenses and PLC administration consumed £6.98 million.
Debt costs and repayment, primarily from the Big Rock project and increased Santander debt levels, totaled £7.81 million, resulting in total adjusted fund earnings after debt service of £5.96 million. Forward-Looking Statements and FY26/27 Commitments Management acknowledged the difficult year while positioning the company for recovery through its strategic initiatives. The outlook presentation identified current challenges including the substantial NAV decline driven by revised third-party revenue curves, lower returns from reduced revenues, and persistent share price discount.
The company responded with a refreshed board, rebased dividend, revised strategy, and reset valuation assumptions. For FY26/27, the company committed to three specific targets: £25 million in targeted disposals, approximately 100 MWh of capital recycling, and 7 pence per share in dividends delivered as quarterly payments of 1.75 pence. Chairman Angus Gordon-Lennox stated: "We are absolutely laser-focused on not reducing value for shareholders.
We want to increase value for shareholders, and we want to return some of that capital to shareholders while we are doing that." The board established clear KPIs and committed to regular progress reporting. Management noted that if no asset sale is completed before declaration of the June 30, 2026 dividend expected mid-September, the dividend may not be paid, which would trigger an earlier continuation vote.
The company emphasized that the current CapEx environment is favorable, with augmentation costs approximately 50% lower than two years ago. Management is evaluating future duration extensions, particularly in Ireland, as market conditions evolve and policy environments develop. Investment manager Alex O’Cinneide defended the portfolio’s positioning: "The NAV which is obviously a headline piece of news from today, features that as we take down the third-party curves.
We have a portfolio that is well-distributed between key markets and has a high level of contracted income, which helps offset volatility in merchant power markets." The presentation concluded with a three-year growth plan to follow the current stabilization and capital recycling phase, targeting conversion of the portfolio’s scale into realized shareholder value through a leaner cost base, strengthened stakeholder alignment, and capital deployment into higher-return opportunities. Full presentation:
- Published
- Jul 15, 2026
- Updated
- Jul 15, 2026
- Source
- Investing Canada
- Category
- Business
- Read time
- 9 min
Key facts
Why this matters locally
This business story matters locally because it may affect readers, businesses, commuters, families, or public services in British Columbia.
Local impact
BC Post links this item to British Columbia coverage so readers can follow related city updates, weather, traffic, events, and category news in one place.
Timeline
Source and credit
BC Post may summarize, organize, and add local context for reader clarity. Original reporting remains with the listed publisher.
Related Articles
View all Business
AI Market Trends: Q2 2026 Review and Forecast
Business
AI Market Trends: Q2 2026 Review and Forecast
 Business
Starchuk seeking judicial review of Surrey arena land-swap
Business
Starchuk seeking judicial review of Surrey arena land-swap
 Business
B.C.'s Massey Tunnel replacement doubles in cost to estimated $8.5 billion
Business
B.C.'s Massey Tunnel replacement doubles in cost to estimated $8.5 billion
 Business
Earth Angel Worldwide Expands Its Mission Through Music, Education and Environmental Stewardship
Business
Earth Angel Worldwide Expands Its Mission Through Music, Education and Environmental Stewardship
More Local Coverage
Latest news Politics
Powerful pro-life ad featuring boxing legend to air during final World Cup matches
Politics
Powerful pro-life ad featuring boxing legend to air during final World Cup matches
 Local News
Cowichan sports shorts: rugby, hockey, biking
Local News
Cowichan sports shorts: rugby, hockey, biking